What Advanced Reports can do?
-
Time to Purchase Reports
Facility to generate time to purchase report which helps taking elusive decision for better user experience
-
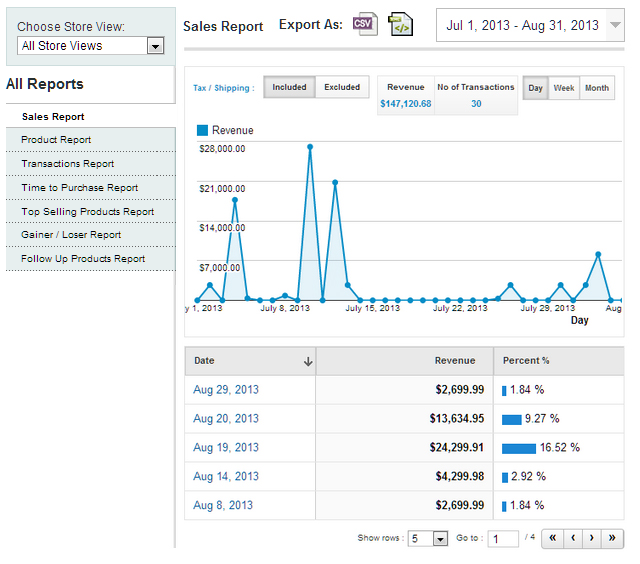
Sales Reports
Facility to display total revenue in graphs, to filter data for any date period, and to export complete report data in CSV or XML formats
-
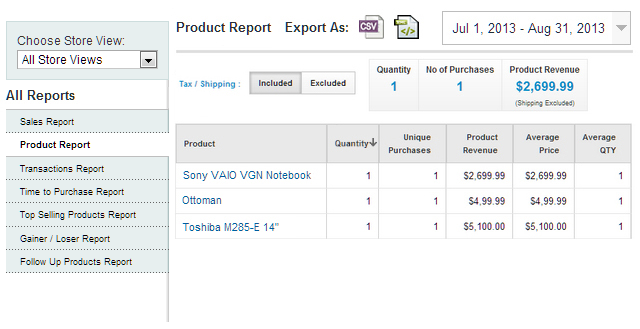
Product Reports
Facility to display quantity and revenue for each product in graphs, to filter data for different time periods and to export reports in CSV/XML formats
-
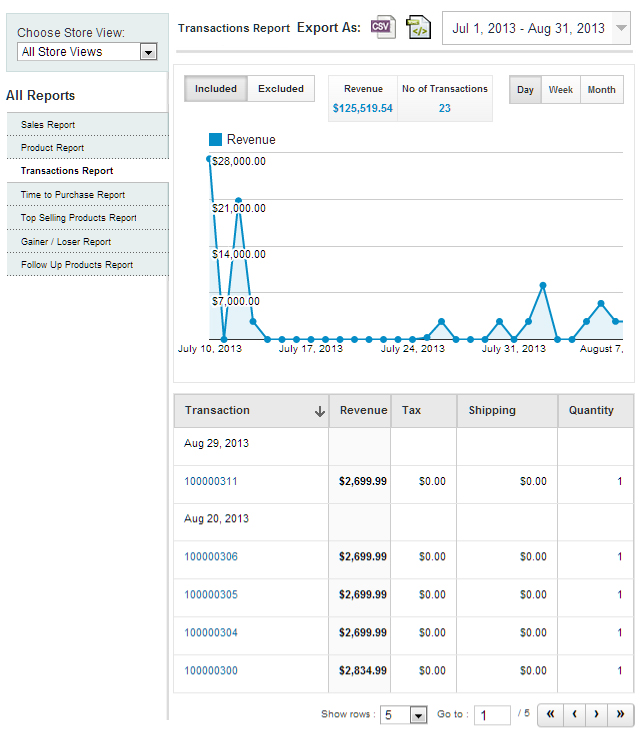
Product Transaction Reports
Facility to display transaction reports in graph, shipping cost and tax information in tables, option to filter data and export reports in CSV/XML formats
-
Custom Periods Reports
Option to view graph and details for any particular period by picking "from" and "to" dates for chosen custom period
-
Export Reports
Facility to export report or data in CSV, or Excel XML formats with a single click on link Export with absolute ease
-
Perfect Dashboard
Impresses you with a Google analytics-like Dashboard to view, track, analyze source and customer behaviors easily
-
100% Customization
Option to customize front end visibility and backend functionality to better access customer details
Customers who are impressed!
-
" We have done some projects with Apptha, Great products and good understanding of the customer needs. Knowledgeable staff.. "
Colin PhillipsBusiness Manager, People & Technology
-
" We have used apptha.com solution for one our last project, and they are absolutely perfect in all aspects of cooperation.. "
Kamil BFounder and Owner, NejPomocnici
-
" I used Apptha products for one of my projects, customer service was amazing and help me a lot to select the best solution... "
Majid A.Communication & Marketing Manager, UAE
Features
For The Store Owners
- Provides with Google Analytics-like visualized sales data metrics and charts
- Provides with 7 types of reports to track sales completely
- Option to track reports in an easily understandable manner
- Option to track sales performance by date, product and transactions
- Facility to estimate overall/total revenue and transaction counts
- Option to export report/data in CSV or Excel formats (for 7 types of reports)
- Option to filter sales data for custom dates(Sales report, Product report, Transactions report, Time to Purchase report and Gainers/Losers report)
- Option to filter data for different dates and days such as Today, Yesterday, Last Week, Last Month and Custom (Sales report, Product report, Transactions report, Time to Purchase report and Gainer/Loser report)
- Pagination and sorting facility for reports (Sales Report, Product Report, Transactions Report, Follow-up Products Report)
- Option to filter and show rows for 5, 10, 25, 50 and 100 (for Sales Report, Product Report, Transactions Report, Follow-up Products Report)
- Option to go directly to any report page with zero page load (for Sales Report, Product Report, Transactions Report, Follow-up Products Report)
- Displays revenue and percentage of sales for each day
- Option to view the list of products sold on the particular date
- Option to follow-up products or not to possible by checking/unchecking the checkbox while mouse over on the product name in product report
- Displays revenue and transaction counts for each product
- Option to filter and re-generate reports based on product
- Displays unique purchases, product revenue, average price, average quantity sold for each product in table
- Option to sort product report data by clicking on the header/title of each column
- Option to filter and regenerate all the reports based on store view
- Displays data in graph for quantity vs. duration
- Option to filter and re-generate graphs based on durations such as day, week, month and custom (for Sales Report, Product Report and Transactions Report)
- Displays quantity sold, revenue, tax information, shipping cost for each transaction in table
- Displays total number of transactions completed till the current date
- Displays data in pie chart for "Days to Transaction" Vs. "Transactions"
- Displays total number of transactions for each "Days to Transaction"
- Displays total percentage for each "Days to Transaction"
- Displays sales details of last 6 months in top selling products report table
- Displays total revenue of top 25 sold products in top selling products report table
- Displays top 10 profit achieved products' revenue for 'selected date' and 'previous' date
- Displays top 10 minimal profit achieved products' revenue for 'selected date' and 'previous date'
- Displays follow-up products' revenue for 'selected date' and 'previous date'
Quick View ofAdvanced Reports